Statistical Methods Resources

Statistical Methods Resources
Statistical Methods
The table below gives criteria for choosing the most appropriate statistical method. These methods perform hypothesis tests and are most frequently used to describe the data using univariate tests. Often multivariable methods are of more interest to the researcher.
In addition to these basic statistical methods it is important to use simple graphs or contingency tables to check for outliers, distribution of the data or correct assignment of categories.
The following link provides more details on basic statistics and provides sample code
CHOOSING THE CORRECT STATISTICAL TEST IN SAS, STATA, SPSS AND R
Number of Groups/Independent Variables |
Outcome [Dependent] Variable |
||
Continuous and Normally Distributed(Parametric) |
Continuous and Skewed | Ordinal(Non-Parametric) |
Binary (2 categories) |
|
1 Group |
Sign Test I Signed Rank Test |
Chi-Square Test / Fisher's Exact | |
2 Independent Groups |
Two Sample 1 Test Linear Regression |
Mann-Whitney U Test |
Chi-Square Test / Fisher's Exact Logistic Regression |
Paired [Related] Sample(2 time points) |
Paired T Test Bland-Altman Method
|
Wilcoxon Signed Rank Test |
McNemar's Test Kappa Statistic
|
>2 Independent Groups |
One-way ANOVA Test Linear Regression |
Kruskal-Wallis Test |
Chi-Square Test / Fisher's Exact Test Logistic Regression |
>2 Related Samples[>2 Time points |
Repeated Measures ANOVA | Friedman's Test | Not covered |
Continuous |
Pearson's Correlation Linear Regression |
Spearman's Rank Correlation Linear Regression |
Logistic Regression |
Epidemiological Data |
Sensitivity & Specificity PPV & NPV ROC |
||
What is Regression Analysis?
Regression analysis is a form of predictive modelling technique which investigates the relationship between a dependent (target/outcome/response) and independent variable(s) (predictor/explanatory). For example, relationship between rash driving and number of road accidents by a driver is best studied through regression.
The key elements of building a regression model:
| Regression | ||
↓ |
↓ |
↓ |
|
Number of independent variables e.g. univariate, multivariate |
Shape of the Regression line e.g. polynomial terms, nonlinear regression |
Type of dependent variable e.g. generalized linear model, logistic regression, Cox proportional hazard regression |
Linear Regression establishes a relationship between dependent variable (Y) and one or more independent variables (X) using a best fit straight line (also known as regression line).
It is represented by an equation Y=a+b*X + e, where a is intercept, b is slope of the line and e is error term. This equation can be used to predict the value of target variable based on given predictor variable(s). The difference between simple (univariate) linear regression and multiple (multivariate) linear regression is that, multiple linear regression has more than one independent variable, whereas simple linear regression has only one independent variable.

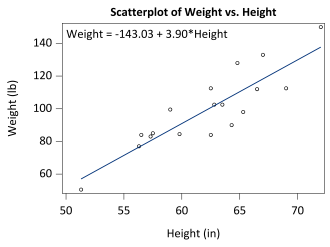
The above model can be interpreted to mean that for every one inch increase in height on average there will be a 3.9 pound increase in weight.
The most common method used to fit a regression line is the Least Square Method. It calculates the best-fit line for the observed data by minimizing square of the errors. Linear regression requires that the dependent variable is a continuous variable and is normally distributed.
A few key points about Linear Regression:
- Fast and easy to model and is particularly useful when the relationship to be modeled is not extremely complex and if you don’t have a lot of data.
- Very intuitive to understand and interpret.
- Linear Regression is very sensitive to outliers.
Logistic Regression
| odds = |
probability of event occurrence ――――――――――――――― probability of not event occurrence |
odds ratio = |
odds of developing the disease given exposure ――――――――――――――― odds of developing the disease given non-exposure |
Logistic regression is used to find the probability of event=Success and event=Failure. We should use logistic regression when the dependent variable is binary (0/ 1, True/ False, Yes/ No) in nature. The logistic regression model uses the odds and odds ratio.
A few key points about Logistic Regression:
- It is widely used for classification problems.
- Logistic regression does not require a linear relationship between dependent and independent variables because it applies a non-linear log transformation to the predicted odds ratio.
- The independent variable should not be correlated with each other (no multi collinearity).
- The values of the dependent variable may also be ordinal (ordinal logistic regression) or multi class (multinomial logistic regression).
Polynomial Regression
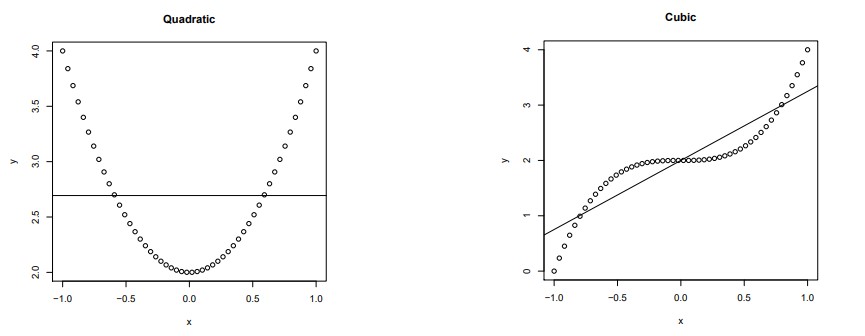
When we want to create a model that is suitable for handling non-linear data, we will need to use a polynomial regression. In this regression technique, the best fit line is not a straight line. It is rather a curve that fits into the data points. For example, we can have higher-order polynomial terms in the model something like Y=a+b*Xk. Where Xk indicates the kth-order polynomial term, k=1, 2 (quadratic), 3 (cubic)...
Polynomial regression requires that the dependent variable is a continuous variable and is only used when the shape of the relationship between the independent and dependent variables is not a straight line.
A few key points about Polynomial Regression:
- It is much more flexible in general and can model some fairly complex relationships.
- Requires careful design and some knowledge of the data in order to select the best exponents.
- While there might be a temptation to fit a higher degree polynomial to get lower error, this can result in over-fitting. Always plot the relationships to see the fit and focus on making sure that the curve fits the nature of the problem.
More advanced Regression types and technics:
Generalized Linear Models
If your dependent variable is neither continuous (general linear model) nor binary, you will need to look into a Generalized Linear Model methods to first find a distribution that best describes your dependent variable, then fit a regression model with the specific distribution and its corresponding link function.
- Gamma, Inverse-Gaussian if the dependent variable is from a skewed distribution (e.g. length of stay, income, cost).
- Poisson, Negative Binomial if the dependent variable consists of counts/integers (e.g. number of medication, count of procedures).
- Beta distribution if the dependent variable consists of a proportion/percentages which is bounded by 0 and 1 (e.g. proportion of feed intake, any measures that are percentages).
- Mixture distributions, the distribution of the dependent variable is a composition of more than one distribution.
Ordinal/multinomial regression
- The values of the dependent variable may also be ordinal (ordinal logistic regression) or multi class (multinomial logistic regression).
- An example of an ordinal outcome would be a Likert scale (strongly agree, agree, undecided, disagree, strongly disagree), and an example of a multinomial outcome would be a list of selected objects (e.g. type of lesions).
- These models are more difficult to interpret, and where possible you should try to combine the levels of the dependent variable to make logistic regression suitable.
Variable selection methods under regression framework: Backward Elimination, Forward Selection, and Stepwise Regression
This form of regression is used to select the independent variables with the help of an automatic process. The aim of modeling techniques is to maximize the prediction power and minimize the number of predictor variables. Some of the most commonly used model selection methods are:
- Backward elimination starts with all predictors in the model and removes the least significant variable for each step.
- Forward selection starts with most significant predictor in the model and adds variable for each step.
- Standard stepwise regression does two things. It adds and removes predictors as needed for each step.
Sources
https://www.analyticsvidhya.com/blog/2015/08/comprehensive-guide-regression/
https://towardsdatascience.com/5-types-of-regression-and-their-properties-c5e1fa12d55e
Regression Analysis: Additional Resources |
||||||||||
|
“Regression techniques are one of the most popular statistical techniques used for predictive modeling and data mining tasks. On average, analytics professionals know only 2-3 types of regression which are commonly used in real world. They are linear and logistic regression. But the fact is there are more than 10 types of regression algorithms designed for various types of analysis. Each type has its own significance. Every analyst must know which form of regression to use depending on type of data and distribution.” https://www.r-bloggers.com/15-types-of-regression-you-should-know/ |
||||||||||
|
For in depth consideration of specific types of regression models consult Penn State Stat 501 Regression Methods Lesson 15 on Logistic, Poisson & Nonlinear Regression is especially helpful |
||||||||||
|
To look up software code and results interpretation see the stats.idre.ucla.edu pages. Use the 4th column of the table to look up the regression type assuring that your data match the information from the first 3 columns. Regardless of the software you select from the table the website provides information on the theory behind the model and interpretation of output from the software. https://stats.idre.ucla.edu/other/mult-pkg/whatstat/
In health research, the questions that motivate most studies are interested in identifying causal relationships, not associational relationships. For example, what is the efficacy of a specific drug on a specific population? What was the cause of death of a given individual? Are certain environmental exposures harmful? What is the efficacy of new therapy X? These are all causal questions. Causal analysis is now well established, but requires extensions to the standard mathematical language of statistics. The following links will help guide the researcher through these concepts.
Python package for causal inference: Python package that implements various statistical and econometric methods used in the field variously known as Causal Inference, Program Evaluation, or Treatment Effect Analysis. |
Contact Us
Williams Building
University of Utah Research Park
Williams Building, 1st floor
295 South Chipeta Way
Salt Lake City, Utah
Map
Parking: During construction, you may park on the bottom floor of the south parking structure.
Contact
Camie Derricott
Phone: 801-587-5212
Fax: 801-581-3623
Acknowledging the SDBC
Please use the following text to acknowledge the CTSI Study Design and Biostatistics Center:
"This investigation was supported by Translational Research: Implementation, Analysis and Design (TRIAD), with funding in part from the National Center for Advancing Translational Sciences of the National Institutes of Health under Award Number UM1TR004409. The content is solely the responsibility of the authors and does not necessarily represent the official views of the National Institutes of Health."
"This investigation was supported by the Study Design and Biostatistics Center (SDBC), with funding in part from the National Center for Advancing Translational Sciences of the National Institutes of Health under Award Number UM1TR004409. The content is solely the responsibility of the authors and does not necessarily represent the official views of the National Institutes of Health."
